By Jonathan Coppess, Gary Schnitkey.et.al
The Agriculture Improvement Act of 2018 (the 2018 Farm Bill) made revisions to the basic farm payment programs, Agriculture Risk Coverage (ARC) and Price Loss Coverage (PLC) (see e.g., farmdoc daily,
December 12, 2018; February 21, 2019;
March 13, 2019). With this article, the Gardner Agriculture Policy Program and the farmdoc project, with the National Center for Supercomputing Applications (
NCSA) at the University of Illinois, announce the initial (alpha) release of the Gardner-farmdoc Payment Calculator (
https://fd-tools.ncsa.illinois.edu). As discussed, the Payment Calculator will provide farmers with estimated ARC-CO and PLC payments for the 2019 through 2023 crop years.
Background
In December 2018, Congress enacted the Agriculture Improvement Act of 2018 (the 2018 Farm Bill) which reauthorized the programs from the Agriculture Act of 2014 (the 2014 Farm Bill). The 2018 Farm Bill reauthorized the basic commodity support programs (farm payment programs) from the 2014 Farm Bill, Agriculture Risk Coverage at the county level (ARC-CO), Agriculture Risk Coverage, individual coverage option (ARC-IC) and Price Loss Coverage (PLC). The 2018 Farm Bill made minor revisions to both ARC-CO and PLC can be highlighted and summarized as follows:
- ARC-CO now incorporates a trend yield adjustment for the yields used in the payment calculations which Congress instructed should be based on the trend yield adjustment factors used by the Federal Crop Insurance Program;
- PLC will now incorporate a reference price escalator that will increase the statutory reference price if 85% of the five-year Olympic moving average of the marketing year average (MYA) prices (dropping the highest and lowest price years) is above the statutory reference price, but not to exceed 115% of the statutory reference price (note also that loan rates were increased, which impacts PLC (farmdoc daily, December 12, 2018));
- Landowners have an option to update the payment yields used in PLC based on a ratio of average yields and the yields from 2013 through 2017 (farmdoc daily, March 22, 2019; February 20, 2019; January 17, 2019); and
- Farmers will elect either ARC or PLC and the choice is locked for the 2019 and 2020 crop years, but beginning with the 2021 crop year farmers can elect between the programs each year.
USDA’s Farm Service Agency (FSA) operates the farm payment programs and is expected to release the regulations and announce program sign-ups soon. This initial release of the Payment Calculator is based upon the provisions in the statute and will be updated with further information from the regulations, as well as with the latest data for the programs as provided by FSA. Farmers are advised to re-run payment estimates after the final release of the Payment Calculator.
Discussion
Similar to the payment calculator created for the 2014 Farm Bill, the Gardner-farmdoc Payment Calculator offers farmers the ability to run payment estimate modeling for their farms and counties for ARC-CO and PLC on a web-based application that works for computers, tablets and smart phones. As discussed it will run different pricing forecast scenarios and requires minimal inputs by the farmer. Due to the nature of development, we are initially release an “alpha” version of the tool that will be updated for a final release. The alpha version allows farmers to run the Payment Calculator with a “try it out” button that does not require a login and account. This alpha release and “try it out” feature will be discontinued and replaced by a login and account registration tool with the final release. Figure 1 provides a screenshot of this alpha version currently available:
https://fd-tools.ncsa.illinois.edu.

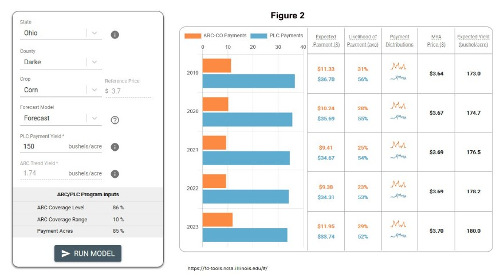
The farmer will enter their state, county and crop into the tool. The alpha release version currently includes only corn, soybeans and wheat but will be updated for the other commodities covered by the programs. The farmer will also enter the PLC program yield for the farm (reminder that this yield can be updated, as indicated above and in previous articles), but the tool incorporates the crop insurance trend yield adjustment factor. Finally, the farmer will select a price forecast scenario discussed further below. Once this information has been selected, the farmer is able to run the model to get estimates for of ARC-CO and PLC payments for the 2019 to 2023 crop years. Figure 2 provides a screenshot of a model run and farmers are reminded that the payment estimates are for the crop year, but program operation and statutory provisions dictate that payments will not be made until after October 1 of the following year; 2019 crop year payments made after October 1, 2020 (farmdoc daily,
November 22, 2016).

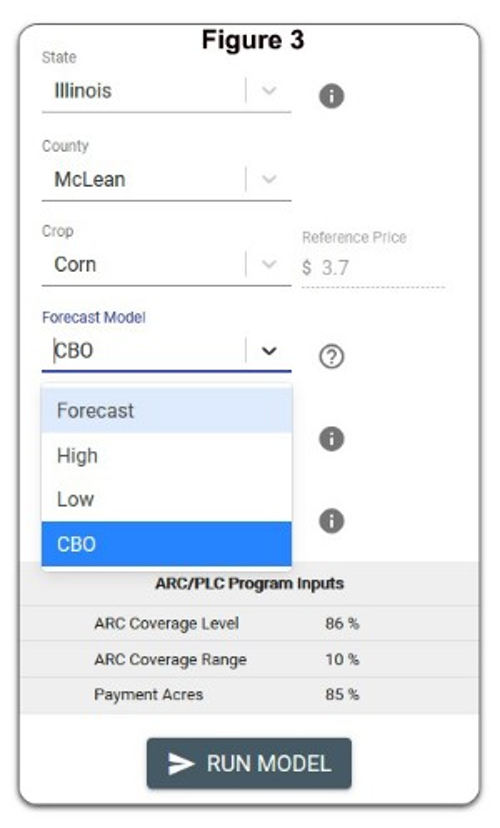
Currently, a farmer can choose form one of four price scenarios: 1) forecast, 2) High, 3) Low, and 4) CBO (see figure 3). The price scenario choice will vary expected prices from 2019 to 2023. In the forecast scenario, the expected price for the 2019 crop year is $3.64 per bushel and the expected yield is 173 bushels per acre. The model simulates 1,000 possible 2019 price and yield combinations for 2019, with the average MYA price being $3.64 per bushel and average yield of 173 bushels; correlations are built in for prices and yields based on historical data. Based on those 1,000 price-yield scenarios, ARC-CO is expected to pay in 31% of the cases (see likelihood of payment) and has an average, or expected payment of $11.33 per acre. By comparison, PLC is expected to pay in 56% of the cases, because the MYA price is below the $3.70 effective reference price. Expected payments for PC are $36.70. If maximizing expected payments is the goal, the model using forecast prices suggests choosing PLC.

Figure 4 shows the four sets of price scenarios that are built into the tool. In addition to the forecast scenario, the tool offers the option for both high and low price scenarios.
The farmer can also select a price forecast by the Congressional Budget Office (CBO
January 2019). Importantly, each year of the price scenario will be used in the program payment estimate model to run 1,000 estimates and average them to estimate the ARC-CO and PLC payments and likelihood of payments under the MYA price forecast for each crop year. It provides an estimate of the potential payment if MYA prices were at the price forecast level for that crop year.
In addition to yearly payment estimates, the Payment Calculator also provides the farmer with estimates for the potential of receiving a payment in the crop year based on the price forecast. The Payment Calculator includes a feature that breaks down the 1,000 model runs into different payment levels, showing the number of times a payment was estimated by the model. Figure 5 provides the distribution for soybeans under the base forecast.
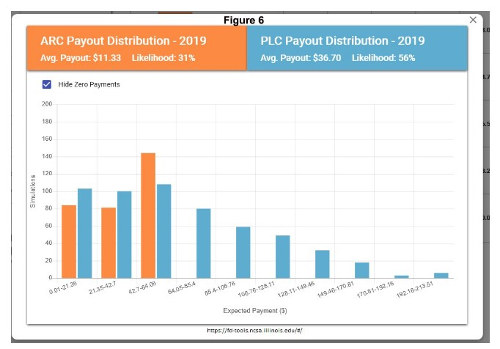
Figure 6 is the distribution of the 1,000 model runs with the zero payments removed. This indicates better the distribution of payments if payments occur; the likelihood they fall into any of the non-zero payment levels.

The distribution feeds the likelihood of payments percentage for the Payment Calculator dashboard in Figures 2, 5 and 6 based upon the distribution of estimated payments over 1,000 model runs. Overall, the estimate is a 31% likelihood of payments for ARC-CO and 56% for PLC in 2019, with 144 out of 1,000 for ARC-CO and 108 out of 1,000 for PLC falling between $42.70 and $64.05 per acre. The above distribution in Figure 7 also illustrates an important feature of the ARC/PLC choice. ARC-CO has a cap on payments at 10% of the benchmark revenue; none of the payments are larger than $64.05 per acre. By comparison, PLC can make larger payments if prices fall further below the effective reference price (down to the loan rate); higher PLC payments occur when MYA prices are very low.
Conclusion
The Gardner-farmdoc Payment Calculator is a web application that allows farmers to run price scenarios to estimate ARC-CO and PLC payments for the five-year life of the 2018 Farm Bill. This article announces the initial or “alpha” release of the Payment Calculator for farmers to try the Payment Calculator out, a final release will include updates based on final program details and data. It will also require an account registration and login. The Payment Calculator was a collaboration among the Gardner Agriculture Policy Program
(https://farmdoc.illinois.edu/policy), the farmdoc project
(https://farmdoc.illinois.edu/) and the National Center for Super Computing Applications (NCSA,
http://www.ncsa.illinois.edu/) at the University of Illinois. Funding for development is from a cooperative agreement with USDA’s Office of the Chief Economist and from the Gardner program funds. Further details about the programs and the Payment Calculator will be forthcoming, including a webinar on August 30, 2019 (
https://farmdoc.illinois.edu/webinars).