By Inder Majumdar and Joe Janzen
Department of Agricultural and Consumer Economics
University of Illinois
India is an agricultural powerhouse. The country is the world’s single largest producer and consumer of milk and pulses. It is the second largest producer of rice, wheat, sugarcane, and cotton (FAO 2022). In an effort to encourage substantial domestic production, fdd122922the Indian government provides annual price guidelines for a set of 23 commodities called the Minimum Support Price (MSP). The MSP is intended to provide a price floor that supports farmers producing commodities crucial to domestic food security. Proponents of the MSP claim that without federally mandated price floors, farmers who grow economically important crops would be subject to excessively volatile market prices.
This article considers the impact of MSP on agricultural market price volatility using a simple comparison for one commodity, wheat, between two states, Uttar Pradesh and West Bengal. One unique feature of India’s MSP program is the fragmented way in which the program is implemented; Despite price floors being mandated at the federal level, each of India’s 28 states and 8 union territories is responsible for adopting the MSP guidelines through its own Agriculture Produce and Marketing Committee (APMC). Each state APMC regulates a within-state network of markets (‘Mandis’) through which farmers sell their produce, enacting a set of fair-trade practices (for example, standardizing weights and measures) deemed necessary by the committee. Regional differences between APMCs are significant; some states have never legislated an APMC, whereas others have strong and active APMC regulation (Chatterjee and Mahajan 2021).
We compare price fluctuations over time between two states with differing levels of APMC regulation and MSP implementation for one commodity, wheat. We find limited differences in wheat price volatility between states, though the probability of large week-to-week price swings is larger in the less regulated market. Our analysis suggests that MSP as currently implemented may not play a significant role in reducing agricultural commodity price market volatility.
Background
The MSP has served as a major political flashpoint since the Indian economy was liberalized in the early 1990s. In September 2020, massive protests occurred after the Indian Parliament passed the Indian Agricultural Acts of 2020 which sought to deregulate trade in agricultural goods. Farmers protested, arguing in part that deregulation through this legislation would subvert the implementation of MSP and threaten their livelihoods. Attempted use of force to quell the protests largely failed, spurring additional unrest. Ten of the country’s largest trade unions called a general strike, bringing in 250 million workers across India. It would later be cited as the largest protest in global history. Eventually, the government relented, repealing the laws in December 2021 (Reuters 2021, Meesala 2021).
Even though the laws being protested did not directly impact the MSP program, the Agricultural Acts provided a means for large agribusinesses to enter into private agreements with farmers without having to transact through the APMC. Farmer cooperatives and advocacy groups are concerned that the Acts would create long-term incentives for agribusinesses to avoid the APMC system altogether, exposing farmers to a marketing environment absent of any government protections currently in place within the Mandi system.
To better understand what the fragmented implementation of the politically important MSP program implies for price volatility, consider the states of West Bengal and Uttar Pradesh. Both rank in the top 10 wheat producing states by production volume, both are in the north of India, and farmers in both states advocated for the continued implementation of MSP during recent protests. The fact that farmers in West Bengal support MSP is surprising, given the inability of their local markets to enact MSP mandates. A government report (Niti Aayog 2016) evaluating the ability of local markets to maintain MSP notes:
“In West Bengal, [the] MSP system has a long way to go. None of the farmers sold their produce at MSP. Intermediaries are quite common owing to the non-existence of [regulated] mandis/marketplaces… millers are not in direct contact with the farmers (except the camps organized recently by the mills on the instructions from the government). It is very difficult for mills to make small purchases from the farmers while it is convenient to deal with the middlemen for the bulk purchase.”
In relative terms, more farmers in Uttar Pradesh consider the MSP program as relevant to their marketing decision. Only 5% of rice and wheat grown in West Bengal is procured under the MSP program (Raghunathan 2022), whereas almost 15% of wheat grown in Uttar Pradesh was procured by the government in 2021 (Shukla 2021). Given that farmers in West Bengal are less likely to sell their crop at the MSP, one might expect APMC market wheat price changes in West Bengal to be highly erratic compared to price fluctuations in Uttar Pradesh, where the MSP is stronger and more active.
Wheat Price Volatility in India
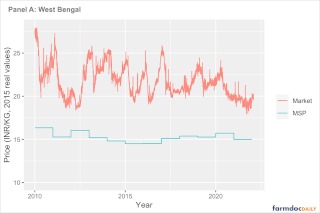
To assess price volatility in Indian wheat markets, we collected twelve years of weekly price data from wheat markets in two states, Uttar Pradesh and West Bengal, from AgMarknet.gov.in, a publicly available market data source provided by the Indian Ministry of Agriculture and Farmer Welfare. Figure 1 plots the average modal or most common price in each week in APMC markets in each state. Prices are given in inflation-adjusted (real) Indian rupees per kilogram. We report prices up to January 2022, just prior to the Ukraine-Russia war that roiled world wheat markets and led to considerable market volatility for wheat in India in particular (Hoskins 2022). Figure 1 also shows the MSP for each year. We see that the Indian government has set the MSP to be relatively constant in real terms since 2010, even though the MSP for wheat has nearly doubled in nominal terms since 2010 (Food Corporation of India 2022). Market prices in both states are volatile – prices vary substantially over time – but in neither market are observed prices close to the floor given by the MSP.
Figure 1. Weekly Wheat Prices in West Bengal and Uttar Pradesh, India, January 2010 to January 2022


Note: Prices shown are an average of government-reported modal (most frequently reported) weekly prices across markets in each state. The published national Minimum Support Price (MSP) is shown for reference. Nominal prices and the MSP for each year are deflated using the Indian consumer price index from the National Statistical Office (NSO), Indian Ministry of Statistics and Programme Implementation (MoSPI).
Source: AgMarknet.gov.in
Using weekly price data, we describe price volatility by calculating returns, or the week-to-week percentage price changes. We plot these returns in Figure 3; it shows that price changes are relatively stable over time. Periods of consistently increasing or decreasing prices are rare, suggesting week-to-week price changes are relatively unpredictable. Wheat market returns in West Bengal range from -10.7% to 12.9%, compared to a range of -10.1% to 17.5% for wheat market returns in Uttar Pradesh. Although volatility is consistent across time in West Bengal, volatility has decreased recently in Uttar Pradesh. This may be attributable to the recent the recent increase in MSP-related wheat procurement from Uttar Pradesh. Government procurement of wheat has increased seven-fold since 2016, with a 33% in MSP-related procurement last year alone (Shukla 2021).
Figure 2. Weekly Wheat Price Changes, January 2020 to January 2022


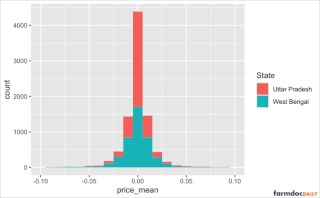
To directly compare wheat price volatility between West Bengal and Uttar Pradesh, we plot the distribution of observed returns in figure 3. The weekly returns for West Bengal are more spread out from the mean than Uttar Pradesh, though the difference in the range of the two distributions appears to be driven by a small number of extremely volatile weeks where price changes exceeded 5%. The standard deviation of each distribution summarizes the spread of each distribution, or the degree to which price changes differ from zero, or no price change in either direction, positive or negative. The standard deviation of weekly price returns for Uttar Pradesh of 1.2% is not statistically distinguishable from the standard deviation of West Bengal of 1.8%, meaning that we do not observe a significant difference in the degree to which each state’s weekly price returns deviate from the mean.
Figure 3. Distribution of Weekly Wheat Price Changes in West Bengal and Uttar Pradesh, 2010-2022

This comparison between West Bengal and Uttar Pradesh provides suggestive evidence of how price volatility differs in a market with a more active APMC regulation and more robust MSP procurement procedures (Uttar Pradesh) versus one without (West Bengal). In general, both markets are subject to the same broad supply and demand forces, so that price levels in each market are roughly similar. The more regulated market of Uttar Pradesh does not experience statistically lower price volatility, although it does appear to avoid the largest week-to-week price swings, especially in more recent years.
We do note this comparison is not intended to be completely representative of the experience in all Indian agricultural markets. Farmers in other Indian states such as Haryana and Punjab are known to rely more heavily on MSP than the farmers in Uttar Pradesh. Analysis of these markets were not feasible due to data constraints but would be required for an in-depth analysis of the impact of this policy on market volatility.
Conclusion
This analysis compares wheat price behavior over time between two Indian states with differing levels of agricultural marketing regulation. We find limited differences in wheat price volatility between states, though the probability of big week-to-week price swings is higher in the less regulated market. Our analysis suggests that MSP as currently implemented may not play a significant role in reducing agricultural commodity price market volatility. If MSP does not significantly decrease price volatility, then the benefits of the MSP program for farmers are unclear.
The MSP is not currently implemented so that it provides a binding floor for realized prices in many cases. Much like price floors provided by the Marketing Loan program for agricultural commodities in the United States, the MSP for wheat in India (as shown in figure 1) has been set well below levels that would affect traded prices. For the government to raise MSP levels significantly and guarantee procurement at higher prices would be very expensive. As currently conceived, the marketing regulation associated with the MSP may have only small impacts on price volatility and provide limited benefits for smallholder farmers.
Source : illinois.edu