By Pierce Paul and Mark Badertscher et.al
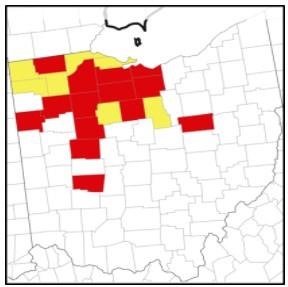
Contrary to what was observed over the last three growing seasons when tar spot was restricted to a few counties in the NW corner of the state, in 2021, the disease has so far been reposted in 21 counties, including as far South as Clark County and as far east as Holmes County. In the past, the disease was seen late in the season (after R4), but this year it was reported in some fields at or before silking (R1). In most of the effected fields, only a few stromata (black tar-like spots) are observed on a few leaves, but in other cases, large sections of fields are affected and there is evidence of an increase in disease severity (percentage of leaf surface covered with stromata) as the crop matures. Severely affected fields show premature drying and wilting of leaves. Another interesting observation is the different in the pattern of development of stromata among hybrids. Disease severity varies considerable among hybrids; some affected hybrids develop many small spots (stromata) that do not seem to increase in size over time, whereas other hybrids develop fewer, but much larger stromata.
Among the many questions being asked by stakeholders are “how is the disease spread round?”, “why so much more tar spot in 2021?” and “why are some fields under rotation with soybean and/or tillage still showing symptoms of tar spot”. Fungal spores move around mainly by rain or wind, with rain being mostly responsible for short-distant spread within a field from crop residue and diseased leaves, whereas wind can carry spores over long distances between fields within counties and even between counties and states. However, the two means of spore movement do not necessarily work in isolation. Rain helps to stimulate the release of spores from crop residue, which are then carried by wind, and later washed out of the air and onto leaves by rain. So, the fact that some fields without a history of tar spot (did not have the disease previously) and some under rotation and tillage, with little or no corn stubble on the soil surface, still developed tar spot suggests that in 2021 wind was likely the primary means of disease spread. Spores were likely picked up and transported from field to field within and across states, and the fact that some fields developed the disease quite early (before R1) allowed more time for it to spread to healthy plant within a field and between fields.
Spores landing in a field will only germinate and infect leaves if the weather condition are conducive and the hybrid is susceptible, and the number and size of the stromata that eventually develop also depend on the weather and the susceptibly of the hybrid. Based on what was observed across the state this year, tar spot appears to be favored by high moisture (extended periods of dew, rainfall, and/or high relative humidity) and a fairly wide range of temperatures. The combination of favorable weather with spores and hybrid susceptibility resulted is the disease being much more severe in some fields this year, and these conditions will also affect disease development next year. However, the trend of rapid and increasing spread of tar spot across the region and within the state over the last few years indicates that the disease is not established, and as such, must be managed to minimize losses. Fungicides do show promising results against tar spot, and we will continue to evaluate products and application timing over the next few growing seasons. However, hybrid selection should be the first line of defense – avoid highly susceptible hybrids.
Map of Ohio showing counties in which tar spot has been reported during the 2021 growing season (red = reported and confirmed in the Paul Lab, yellow = reposted and awaiting confirmation). However, it should be noted that red or yellow does not mean that all fields in a highlighted county has tar spot, it means that the disease was found in at least one field in that county. In addition, the map does not show how severe the disease is in a given county. A single spot, on a single leaf, in a single field was sufficient for a county to be highlighted as being positive for tar spot.

Ohio Tar Spot Map as of 9/7/2021
Source : osu.edu